
Filter Plugins
Kst has a number of built-in filters.
This plugin filters a set of data by using the bilinear transformation formula.
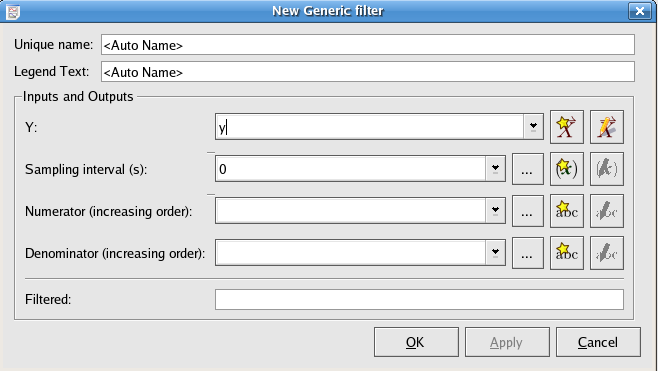
The array of data to filter
The time periods for sampling of the input vector, reciprocal of the sampling frequency
A string of numbers separated by commas to indicate the coefficients of the polynomial as numerator/denominator in the transform formula. For example, if you have a polynomial: 2*z^2 + 3*z + 5, you will need to specify the string: 2,3,5. To input the string, click on the icon
![]() to construct a string with value 2,3,5
to construct a string with value 2,3,5
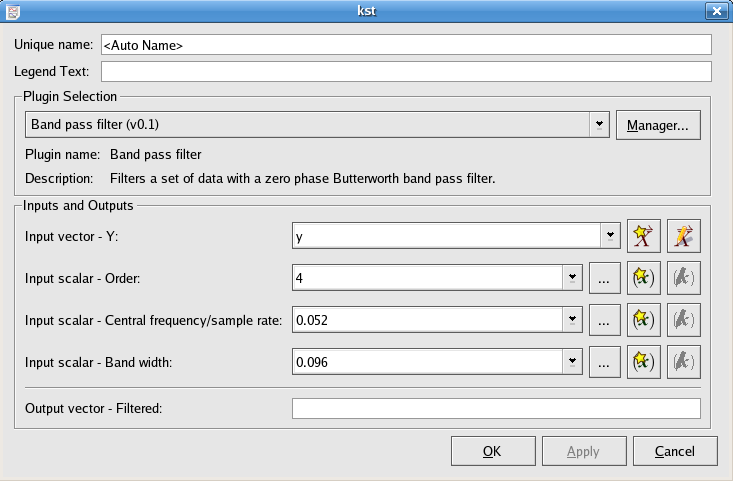
The Butterworth band-pass plugin filters a set of data by calculating the Fourier transform of the data and scaling the spectral amplitudes using the following function G(f)
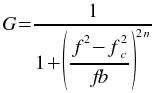
where f is the frequency, fc is
the central frequency to filter around, b is the bandwidth to pass, and
n is the order of the Butterworth filter. The inverse Fourier transform
is then calculated using the scaled spectral amplitudes to give a filtered dataset.
The array of values to filter.
The order of the Butterworth filter to use.
The frequency to filter around.
The width of the band to pass. This should be the difference between the desired high cutoff frequency and the low cutoff frequency.
The Butterworth band-stop effectively removes signals in a given frequency range from an input vector. The options are the same as for the Band-pass filter except that the scaling function G(f) which is used is now given by:
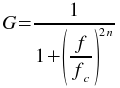
The Butterworth high-pass plugin effectively removes signals below a given cutoff frequency from a data vector. It does this by by calculating the Fourier transform of the data and rescaling the the spectral amplitudes using the following following function G(f)
where f is the frequency, fc is
the high frequency cutoff, and
n is the order of the Butterworth filter. The inverse Fourier transform
is then calculated using the new filtered frequency responses.
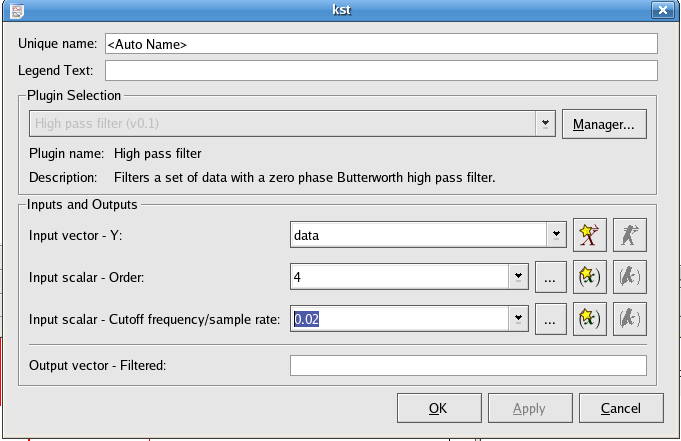
The array of values to filter.
The order of the Butterworth filter to use.
The cutoff frequency (fc).
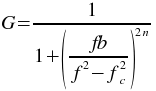
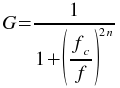
The Butterworth low-pass filter effectively removes signals above a given frequency cutoff from an input vector. The options are the same as for the High-pass filter except that the scaling function G(f) which is used is now given by:
This plugin is used to find and remove spikes in a data set.
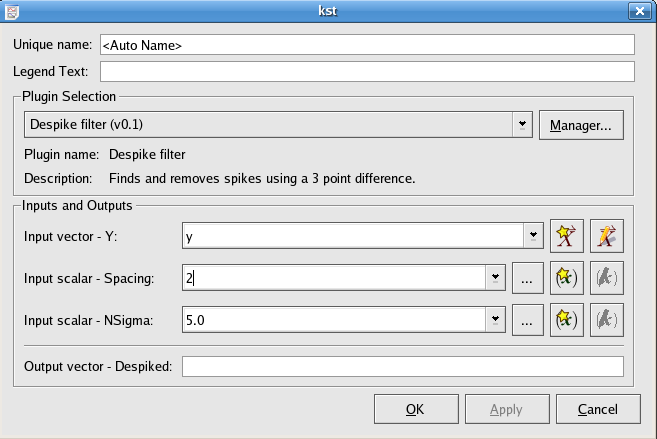
Select the data vector needed to be smoothed.
Specify the width of the spikes.
If a data point value varies from its neighboring data points by NSigma times more, it will be counted as a spike.


Would you like to make a comment or contribute an update to this page?
Send feedback to the KDE Docs Team