
Signal Processing Plugins
Kst provides various plugins to help you easily process signals.
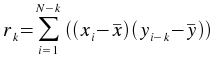
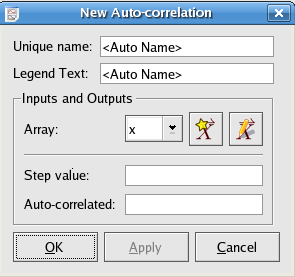
The autocorrelation plugin calculates correlation values between a series (vector) and a lagged version
of itself, using lag values from floor(-(N-1)/2) to floor((N-1)/2), where N
is the number of points in the data set. The time
vector is not an input as it is assumed that the data is sampled at equal time intervals. The correlation
value r at lag k is:
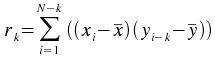
The crosscorrelation plugin calculates correlation values between two series (vectors) x and
y,
using lag values from floor(-(N-1)/2) to floor((N-1)/2), where N
is the number of elements in the longer vector. The shorter vector is padded to the length of the
longer vector using 0s. The time
vector is not an input as it is assumed that the data is sampled at equal time intervals. The correlation
value r at lag k is:
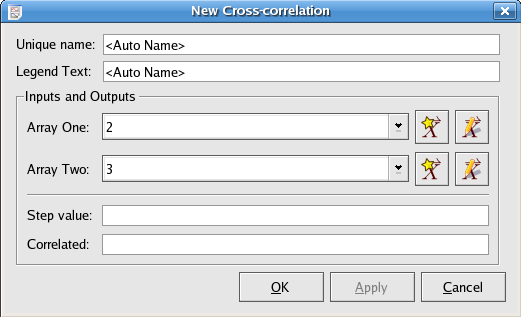
The array x used in the cross-correlation formula.
The array y used in the cross-correlation formula.
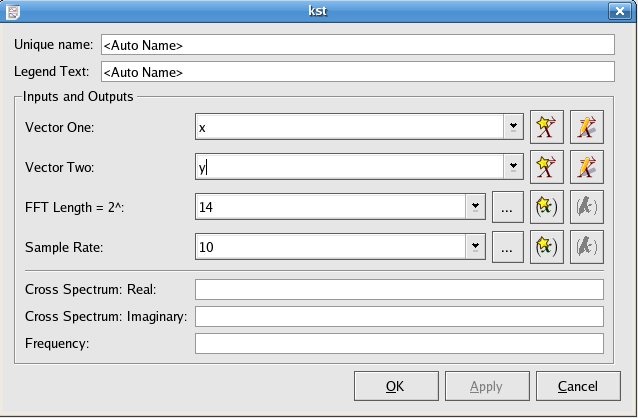
The cross power spectrum plugin takes two vectors and calculates the FFT of their cross-correlation values.
The convolution plugin generates the convolution of one vector with another. The convolution of two functions
f and g is given by:
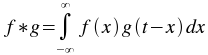
The order of the vectors does not matter, since f*g=g*f. In addition,
the vectors do not need to be of the same size,
as the plugin will automatically interpolate smallest vector to the larger length.
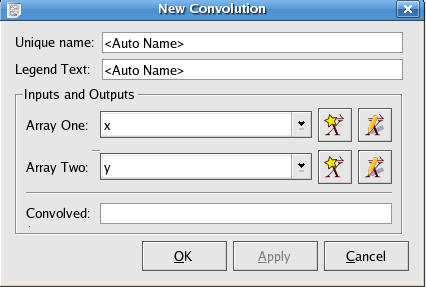
One of the pair of arrays to take the convolution of.
One of the pair of arrays to take the convolution of.
The deconvolution plugin generates the deconvolution of one vector with another. Deconvolution is the inverse of
convolution. Given the convolved vector h and another vector g, the deconvolution
f is given by:

The vectors do not need to be of the same size,
as the plugin will automatically extrapolate the shorter vector. The shorter vector is assumed to be the
response function g.
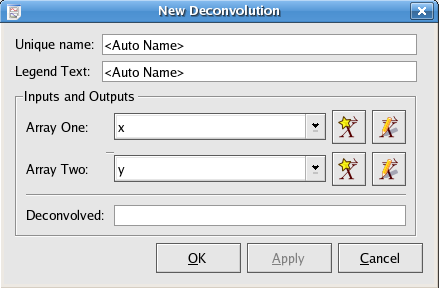
One of the pair of arrays to take the deconvolution of.
One of the pair of arrays to take the deconvolution of.
The periodogram plugin produces the periodogram of a given data set. Periodogram is an estimate of the spectral density of a signal.
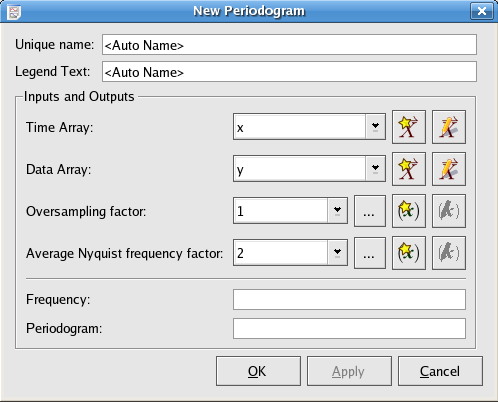
The array of time values of the data points to generate the interpolation for.
The array of data values, dependent on the time values of the data points to generate the interpolation for.
The factor to oversample by.
The average Nyquist frequency factor.


Would you like to make a comment or contribute an update to this page?
Send feedback to the KDE Docs Team