
Creating an Event Monitor
Kst has many features which are oriented toward real-time data. One of the most useful of these features is the "Event Monitor" data object. Event monitors check conditions on data vectors. A common use for them is to provide warnings about unusual features in incoming data. They can provide feedback in a number of ways:
Messages in the Kst debug log.
Automated Electronic Logbook (ELOG) entries.
Email notification.
In this tutorial, we will create an event monitor to provide debug log notification about statistically unlikely spikes in a data stream. More information about Event Monitor data objects can be found here
First we'll need a script to generate some simulated realtime data. Copy the following into a file called simrealtime.pl
#!/usr/bin/perl

open(OUTPUT, ">$ARGV[0]") || die "Can't open $ARGV[0]: $!";

srand(1); # (badly) initialize the RNG.

for ($x=0;;$x++) {
        open(OUTPUT, ">>$ARGV[0]") || die "Can't open $ARGV[0]: $!";
        $rn = rand();
        if ($rn > .99) {
                $rn = $rn + 5;
        } else {
                $rn = $rn - .5;
        }
        print OUTPUT $rn . "\n";
        close(OUTPUT);
        print "Created " . $x . " entries. Press Enter to Continue ...";
        $dummy=<STDIN>
}
This perl script will generate random data, uniformly distributed in the range [-0.5, 0.5], with occasional spikes. Make the script executable and run it using the commands...
chmod a+x simrealtime.pl
./simrealtime.pl simulated.dat
In order to simulate “realtime” data, the script will not generate all of its output at once, but will prompt the user before it outputs each entry. Press the enter key several times to get the data set started. Now, in a separate terminal, instruct Kst to plot the data using the command...
kst -y 1 simulated.dat
Depending on the number of data points which you have generated so far, your plot should look something like the graph below, possibly without the large spike in the middle.
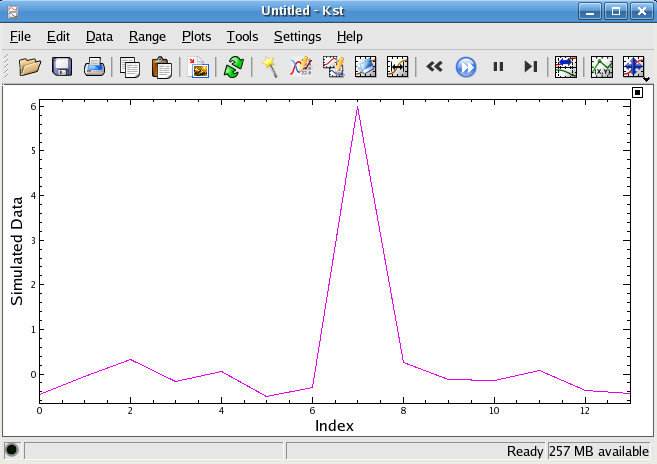
Now, return to the terminal where the simrealtime.pl script is running and press the enter key a few more times. You should see the plot you've made in Kst update automatically as new data is added to the simulated.dat stream.
Suppose that we would like to receive notification every time a large spike occurs in our incoming data stream. This can be done using an event monitor. Select the menu-item ->, and configure the new event monitor's settings as shown below.
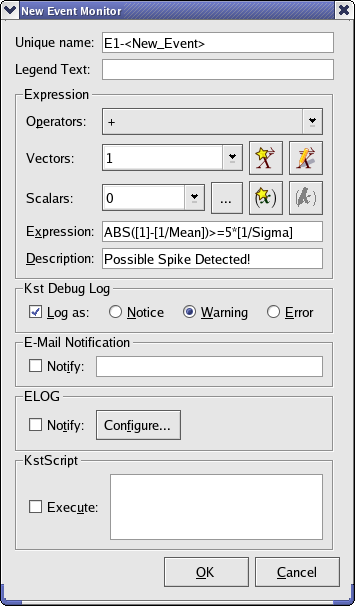
The settings in the Expression text box configure the event monitor to report entries in the vector “1” which are more than 5 standard deviations from its mean. This is a fairly simple event monitor. Much more powerful event monitors can be created using the large collection of scalars which Kst maintains, and the many operators which can make comparisons between vectors.
We will have our events logged as “Warnings” in the Kst Debug Log. As you can see, there are several other possible event reporting methods. These are explained in more detail in the documentation for Event Monitors.
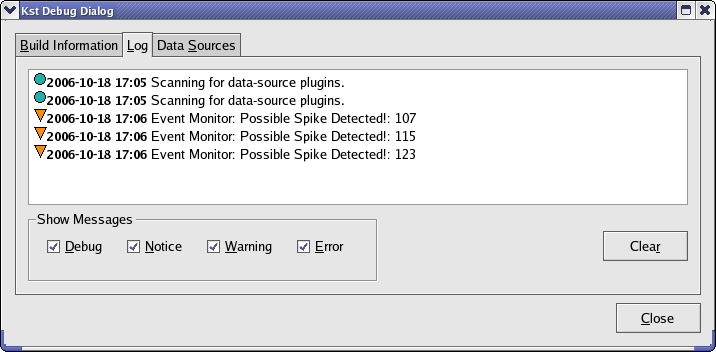
Click the button to create the new event monitor. Now, access the Kst Debug Log by selecting the -> menu-item and clicking the tab. You may see that a spike has been detected. If not, return to the terminal where you are running the simrealtime.pl script and continue generating new data until a number of spikes are visible in your plot. About 1% of the data should be spikes. Spikes which occur near the beginning of the data stream may not have been detected, because Kst didn't yet have enough data to establish a reliable estimate of the standard deviation of the vector “1”. After generating a few hundred data points, your Log may look something like this:
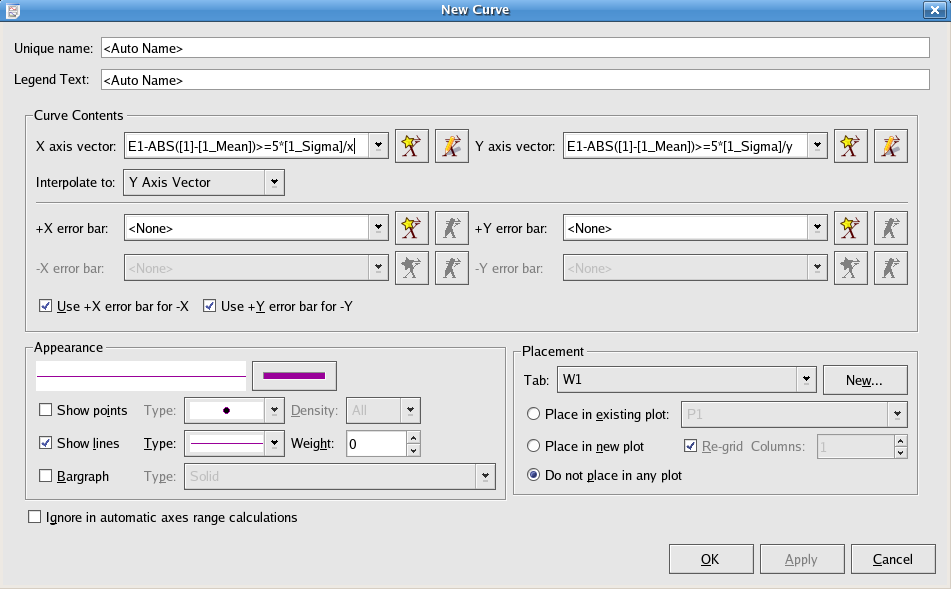
Once you have an event monitor up and running, it's sometimes useful to have Kst indicate on your plots where events have occurred. This is best done using objects called “Plot Markers”. To create plot markers for events, we need to have a Curve Data Object for the events in question. Create a curve data object now by selecting -> and configure the new curve with the options shown below.
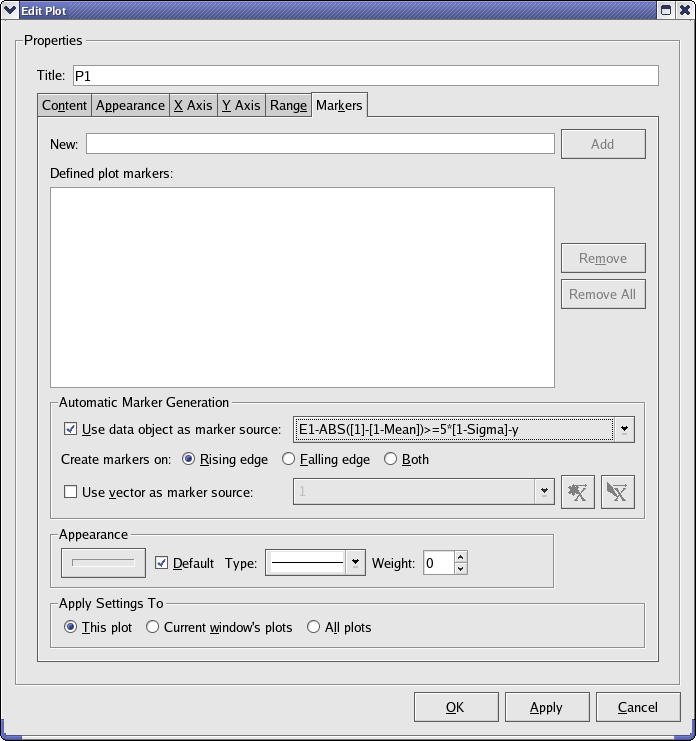
Now we are ready to create plot markers. Right click on the data plot, and on the context menu which appears select . Then select the “Markers” tab and configure it to use our event monitor curve as shown below:
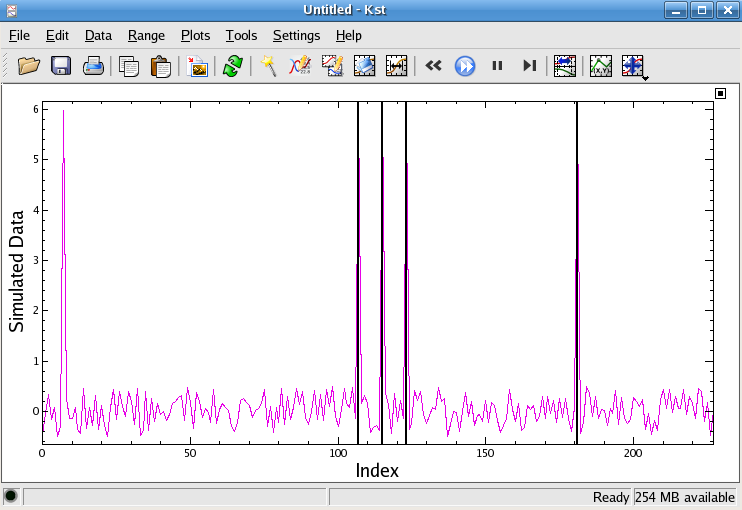
Click the button to create the markers. Vertical lines will now appear on the data plot, indicating the position of the spikes. The usefulness of plot markers is that they will always stretch across the entire y-axis, regardless of the zoom level, as shown in the screenshot below.


Would you like to make a comment or contribute an update to this page?
Send feedback to the KDE Docs Team