
Creating a Power Spectrum
Kst contains built-in routines to generate power spectrum from data. The following example shows how to create a power spectrum.
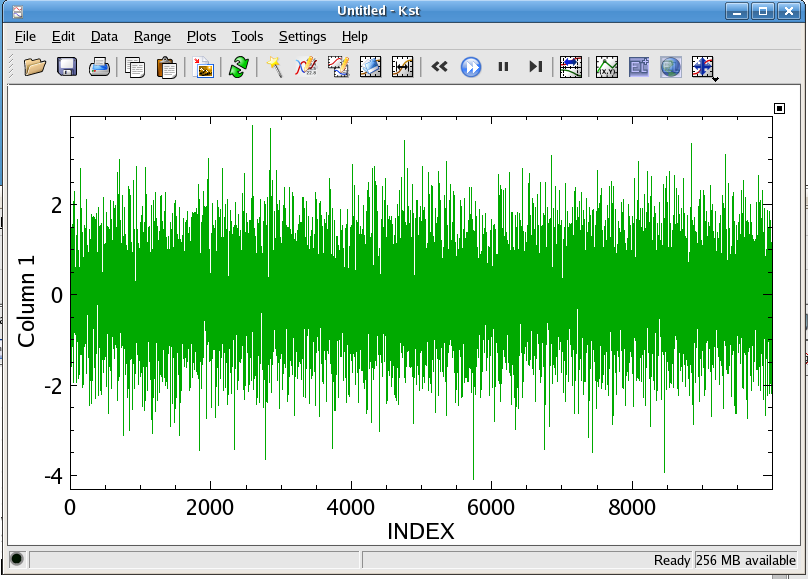
First, plot the normal distributed data vector generated by the perl script: generate_normal.pl in the histogram tutorial.
The plot of the normal distributed data is shown below:
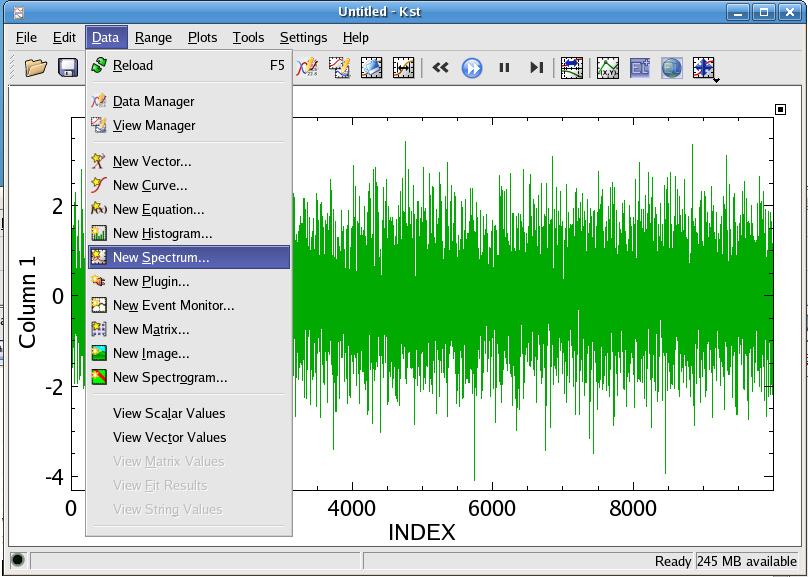
To create a power spectrum from this data vector, choose ->
Then, the dialog for creating a new specturm appears:
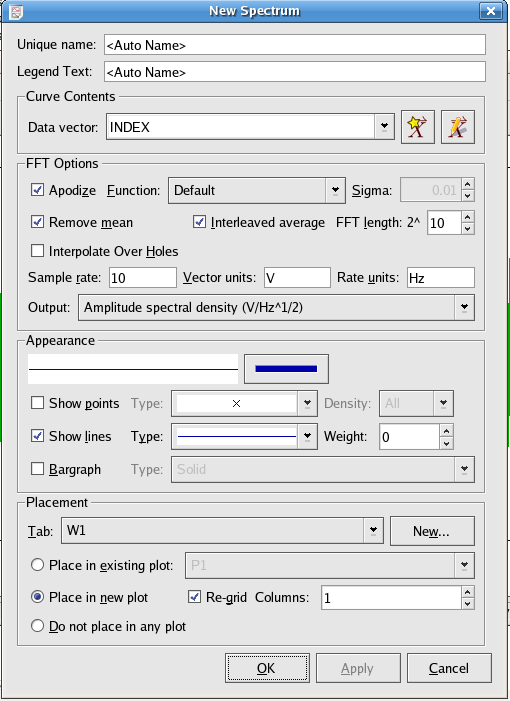
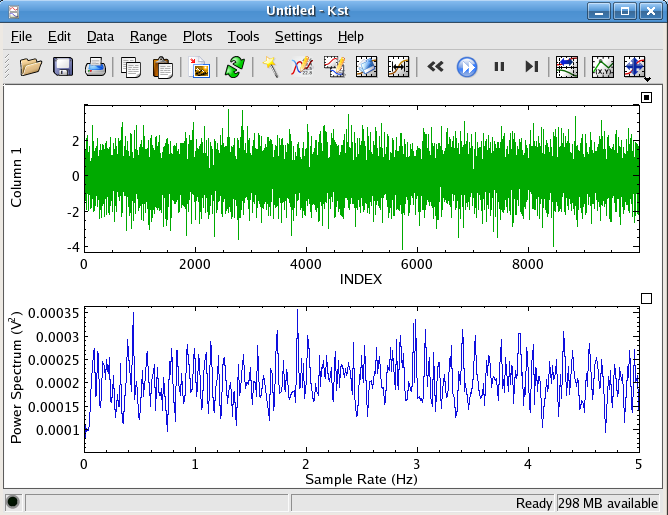
In the text box beside Data vector: select the vector that you want to create a power spectrum from. The default is INDEX, but you can change it by selecting from the dropdown textbox. You can change the name of the specturm in the Unique name text box. FFT option will be explained in detail later in the spectrum section of the data chapter. For a quick look of the resulting spectrum, just use the default choices for the FFT option and click . The following spectrum is generated:


Would you like to make a comment or contribute an update to this page?
Send feedback to the KDE Docs Team