
Generating a Histogram
Kst contains built in routines to generate histograms from data. For this tutorial, we'll look at the histogram of a vector containing normally distributed numbers.
We'll generate this vector using a perl script. Copy the following code into a file called generate_normal.pl:
sub gaussian_rand { # from the Perl Cookbook. (O'Reilly, 1998)
    my ($u1, $u2);  # uniformly distributed random numbers
    my $w;          # variance, then a weight
    my ($g1, $g2);  # gaussian-distributed numbers

    do {
        $u1 = 2 * rand() - 1;
        $u2 = 2 * rand() - 1;
        $w = $u1*$u1 + $u2*$u2;
    } while ( $w >= 1 );

    $w = sqrt( (-2 * log($w))  / $w );
    $g2 = $u1 * $w;
    $g1 = $u2 * $w;
    # return both if wanted, else just one
    return wantarray ? ($g1, $g2) : $g1;
}

srand(time() ^($$ + ($$ <<15))) ; # initialize the RNG.
for ($x=0;$x < 10000;$x++) {
        print gaussian_rand() . "\n";
}
Now execute the script with the command:
perl generate_normal.pl > normal.dat
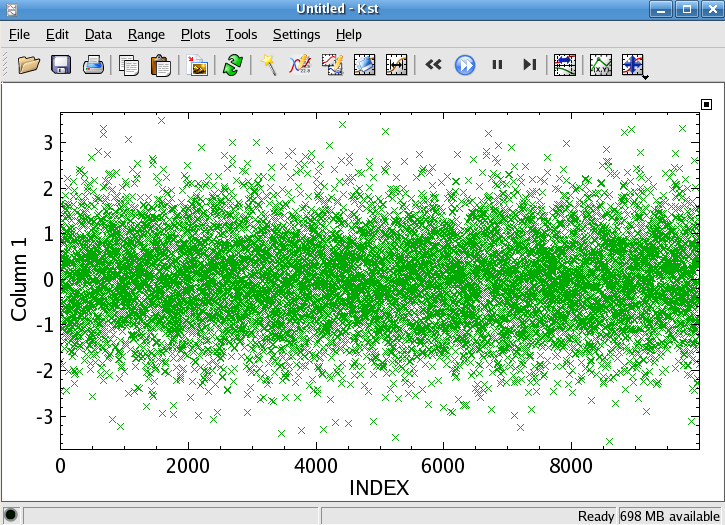
This will generate an ASCII file normal.dat containing random numbers with a gaussian distribution centered at 0 with a standard deviation of 1. Import this data into Kst, and plot it as points with INDEX as the x-axis vector (if this gives you trouble, you may want to see the Getting Started section on Importing Data. You should see something which resembles the following:
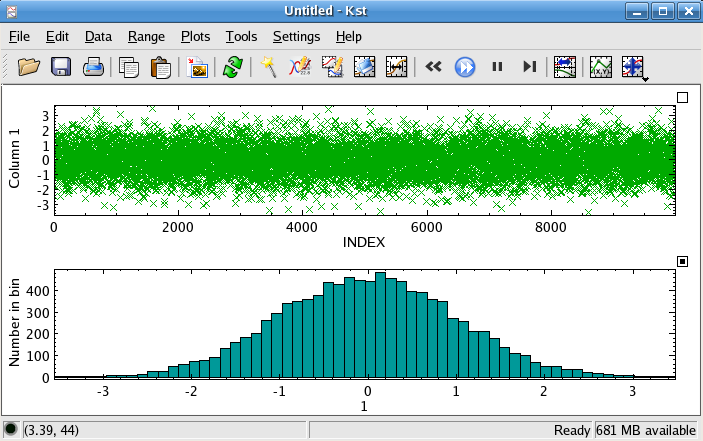
Now we are ready to generate the histogram itself. Select ->. Select the Data Vector which has just been created from normal.dat. There are several options relating to bin choices. For quick generation of histograms, it is usually easiest to just press the Auto-Bin feature. This will select an optimal bin size and range for the given data.
Click the button to generate the histogram.


Would you like to make a comment or contribute an update to this page?
Send feedback to the KDE Docs Team