
| Filters |
| Prev | The Kst Tutorial | Next |
With Kst, we can apply a variety of fits and filters to vectors in kst.
The results of these will be updated in real time as new data comes in.
To demonstrate this, load in the first 1000 samples of second column of
gyrodata.dat
using either the Data Wizard, as demonstrated earlier, or from the command line:
kst2 gyrodata.dat -f 0 -n 1000 -y 2
Once it is loaded, right click in the plot and select from the menu, as shown:
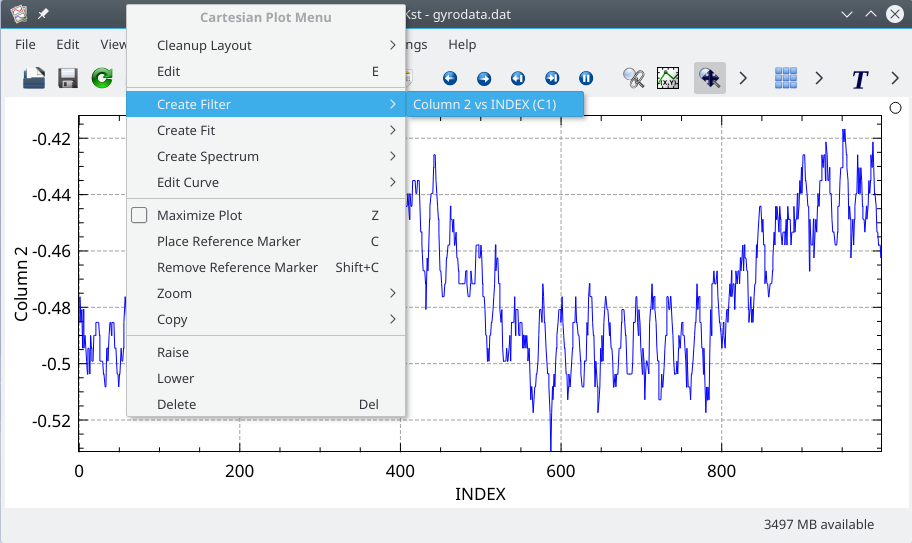
This will bring up the New Filter Dialog:
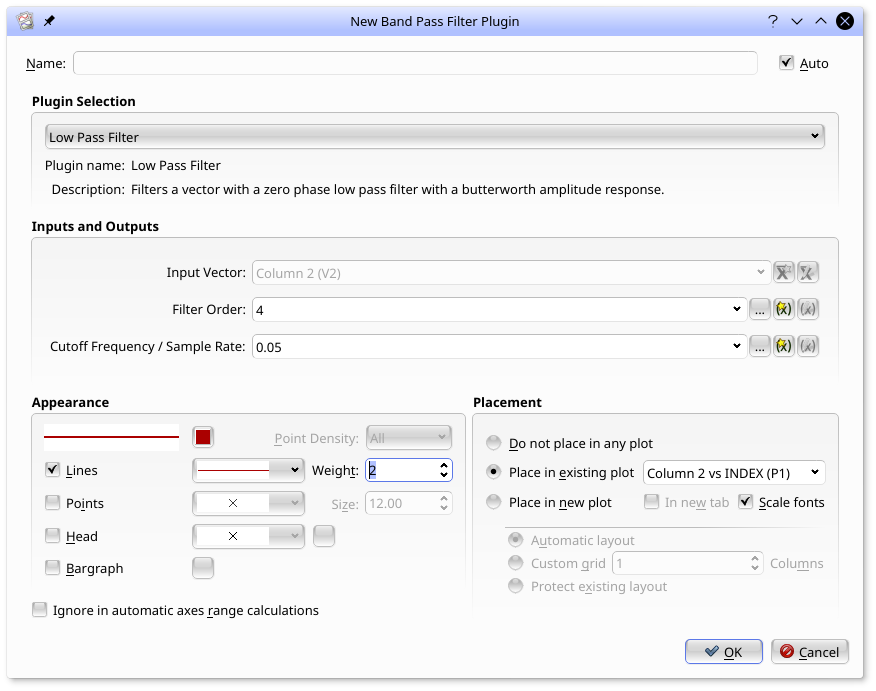
Fill out the dialog as shown. In particular, select as the Plugin, set Cutoff Frequency/Sample Rate to 0.05, and select Place in existing plot. Here we have also set the line to be red, and the Weight to 2, so the line will be more visible. When you are satisfied, select .
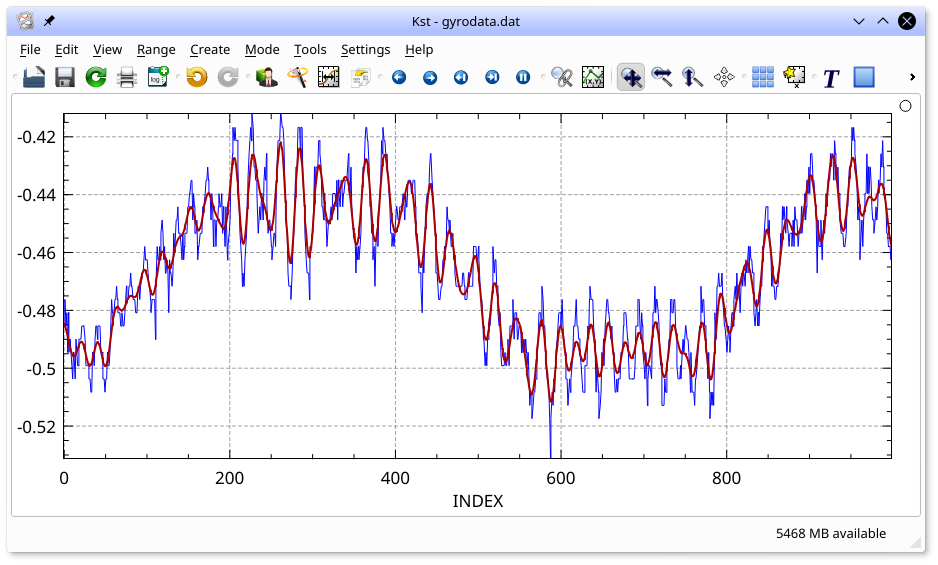
This will add the low-pass filtered data as a new curve in the plot:
In the same way you can fit a variety of functions to curves using the submenu after right-clicking in a plot.
| Prev | Contents | Next |
| A Brief Overview of Data Objects | Up | Working With Data |