
| A Brief Overview of Data Objects |
| Prev | The Kst Tutorial | Next |
In addition to simple plotting, Kst has the ability to do real time analysis of data using a number of “Data Objects”, which include spectra, equations, histograms, fits, and filters.
As a quick demo of Data Objects, lets create a spectrum. Start Kst and re-load
mykstsession.kst that you created in previous sections.
Then, from the menu select
. The New Power Spectrum menu will appear.
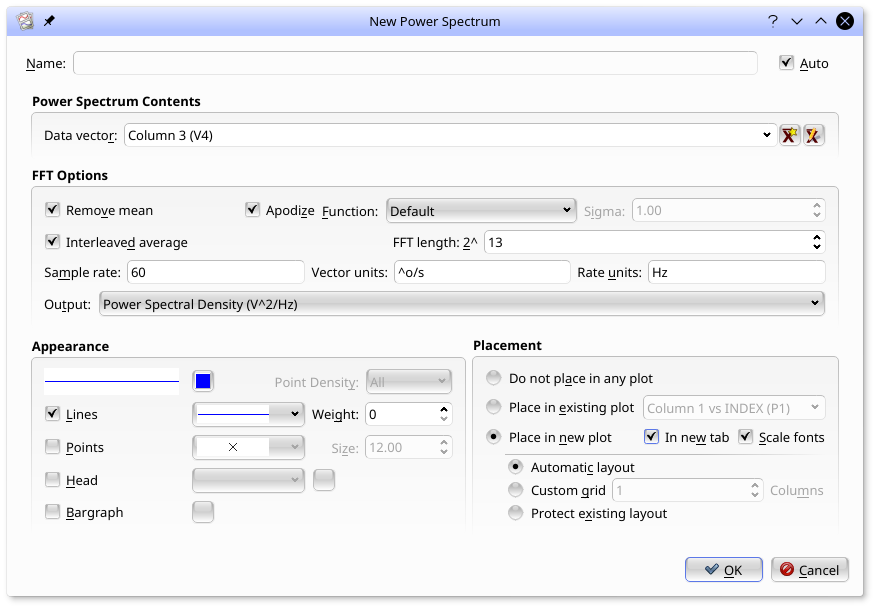
Fill out the dialog as shown. Make sure you select “Column 3 (V4)” as the Data vector, set the FFT length to “2^13”, Sample rate to “60” and select “In new tab” under Placement. Then select . A plot of the spectrum of “Column 3 (V4)” will appear in a new tab.
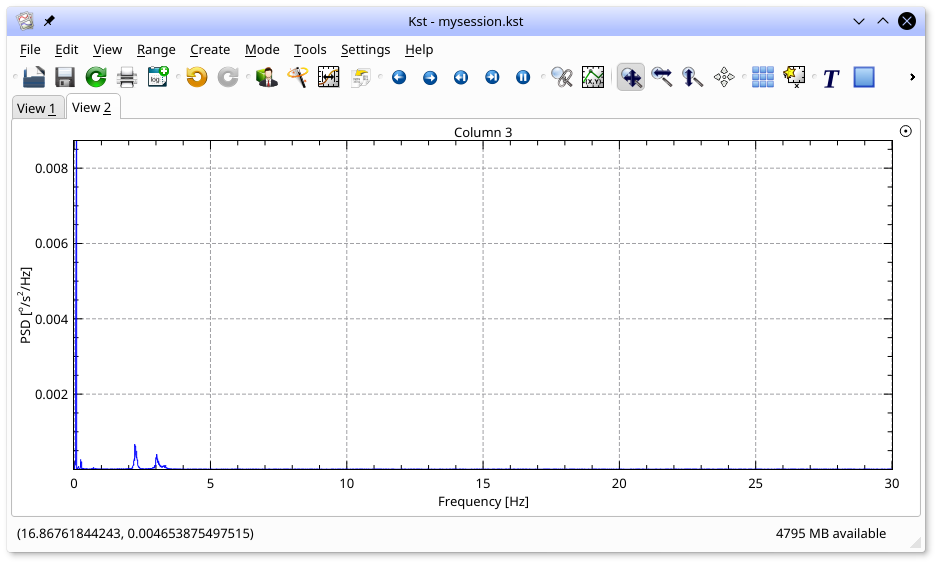
It is hard to see any details in this plot - a log-log plot would be much easier. To toggle the Y axis to log press l (that is, small L) and to toggle the X axis to log press g. (These options are also available in the context menu under the submenu in case you forget the keyboard commands). The plot will now be log-log, as shown:
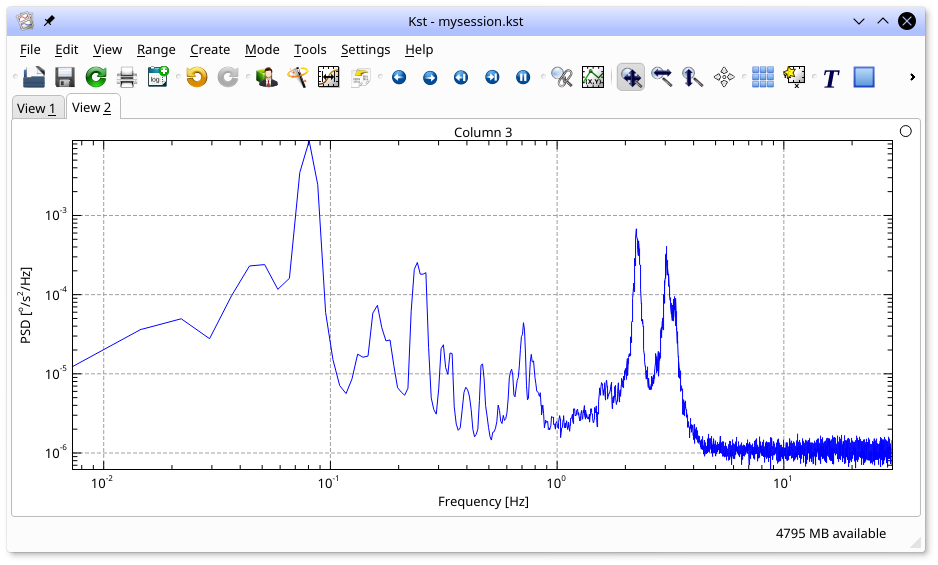
Hitting l (small L) and g will toggle back to linear axis.
From the you can similarly create histograms, spectrograms and equations of fields you have loaded.
| Prev | Contents | Next |
| The Basics of Plot Manipulation | Up | Filters |