
| The Basics of Plot Manipulation |
| Prev | The Kst Tutorial | Next |
Now that you are comfortable with creating plots in Kst, we can explore some of the plot manipulation features
available through the Kst graphical user interface.
Start Kst and load the mykstsession.kst file you saved earlier.
This can be done one of three ways:
From the command line: kst mykstsession.kst
Selecting from the toolbar or from the
menu and selecting mykstsession.kst
from wherever you saved it.
Selecting mykstsession.kst from
in the menu.
All the plots you created earlier should now be loaded in Kst. Consider the plot of Column 1. To take a closer look at that plot, right click in it and select the menu item (see below). Notice that the menu item shows that is a shortcut for this, so you could also just type Z in the plot rather than using the context menu for this. Selecting (either with Z or with the menu) will cause the selected plot to fill the entire kst window.
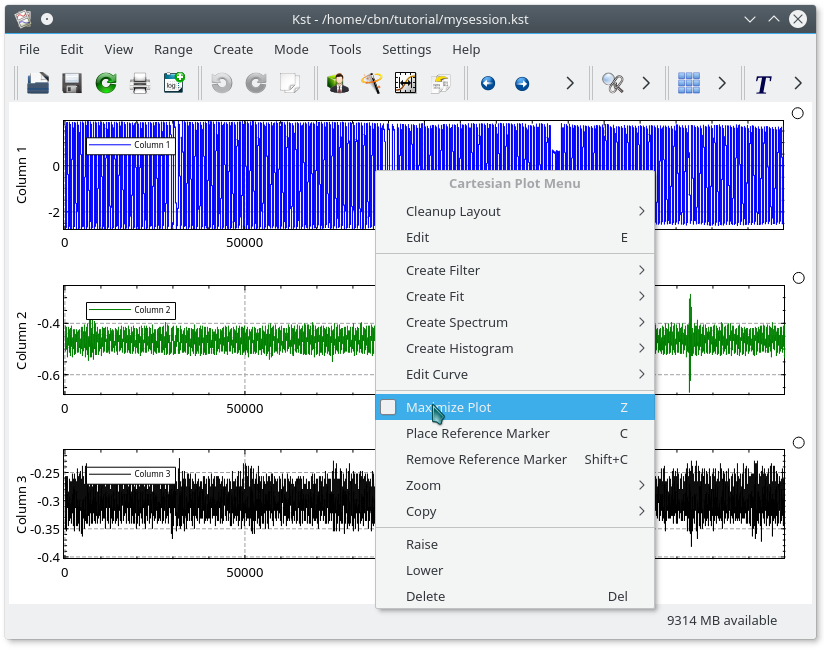
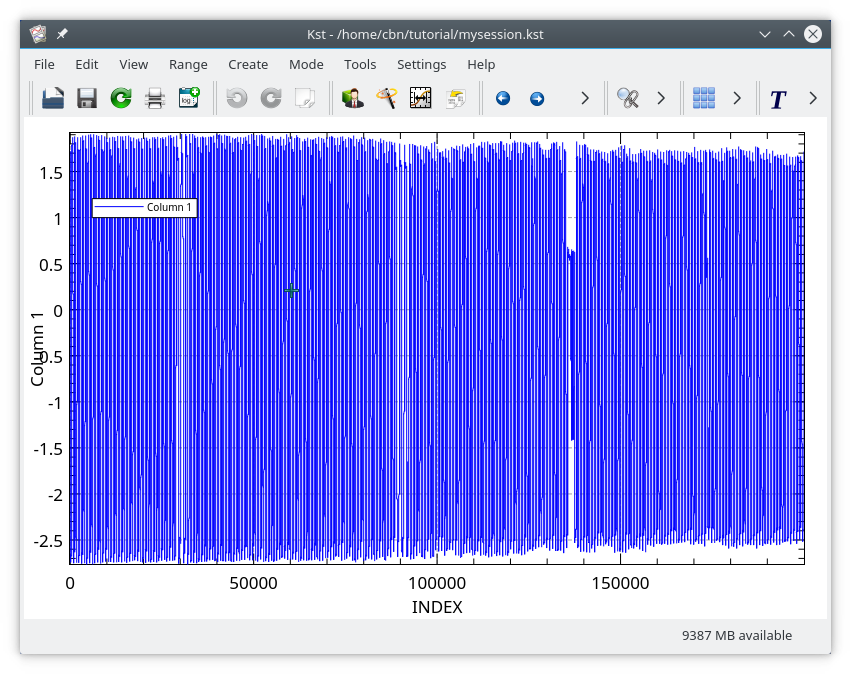
Selecting (or typing Z in the plot) again will restore it the plots to their previous arrangement. This is especially valuable if you have a grid of many small plots and want to temporarily look at just one of them. Obviously typing Z is going to be the most convenient way to do this, but the context menu is there in case you forget.
In Kst, it is very easy to zoom and scroll the data, using either the
mouse or the keyboard. To do this you should be in
mode, selected by selecting the
![]() icon in the tool bar. This is the default mode.
icon in the tool bar. This is the default mode.
To zoom into a region of interest, left-click drag a box in the window with the mouse. When you release the mouse, the window will zoom in X and Y into the region you selected. Holding Shift when you do this will cause the plot to zoom only in Y. Holding Ctrl when you do this will cause the plot to zoom only in X.
Arrow keys scroll the plot. Arrow keys with Shift held down will change the scale. The M key auto-zooms the plots to view all of the data. Play around with these options to become familiar with the various options.
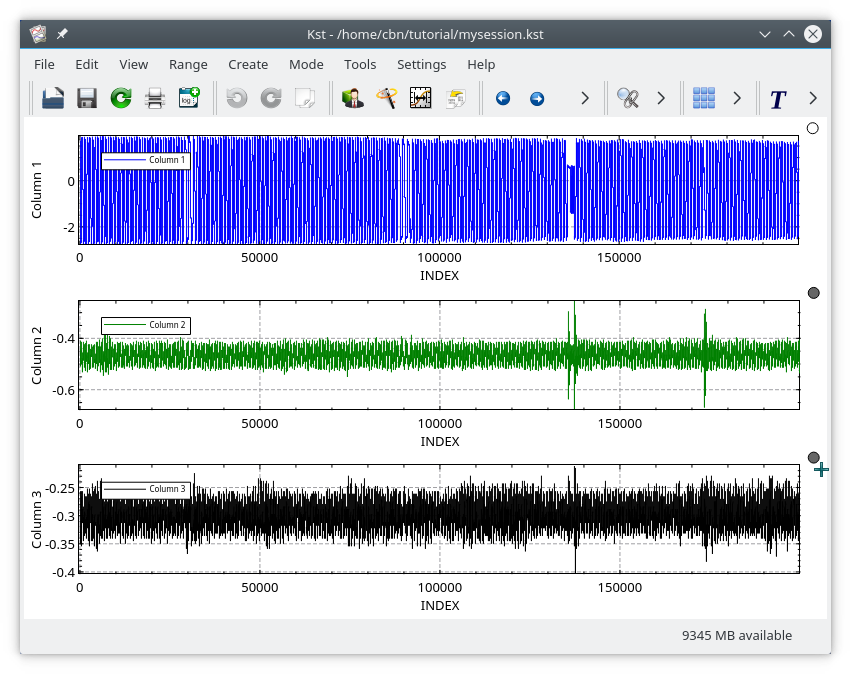
Now look at the plots with y axes labeled Column 2
and Column 3. These are plots of the pitch gyro
and roll gyro, respectively, from an instrument. Since
these two plots are related, it can be useful to zoom and scroll them
simultaneously. Click on the circles located at the top right corners
of the two plots. They should turn dark in color to indicate that
the two plots are now tied together:
Now try zooming in with the mouse on a portion of the green curve in
the middle plot. You will find
that the lower plot will become blank. This is because the lower plot
axes have changed to match the upper plot axes, and there is no data
in that particular region of the lower plot. Type M
while the mouse cursor is over either plot to return to maximum zoom
on both plots. Now hold down Ctrl (this is
equivalent to selecting from the
menu or clicking the
![]() toolbar button). If you
then move the mouse, you will see that it is now dragging a vertical line
the height of the plots in both of the plots that are tied together.
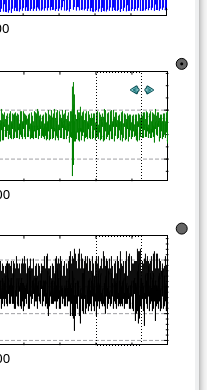
While keeping
Ctrl held down, drag a rectangle in the middle plot.
While dragging, the region you are selecting will be displayed in both
tied plots. Both plots will rescale to the region you have selected.
toolbar button). If you
then move the mouse, you will see that it is now dragging a vertical line
the height of the plots in both of the plots that are tied together.
While keeping
Ctrl held down, drag a rectangle in the middle plot.
While dragging, the region you are selecting will be displayed in both
tied plots. Both plots will rescale to the region you have selected.
As with the mouse actions, the keyboard based zoom/scrolling actions described earlier will now be applied to both plots.
You can quickly tie or untie all the plots in the window by selecting
from the
menu or by clicking the ![]() toolbar button.
toolbar button.
When you are finished experimenting with the zooming features, you can close Kst. There is no need to save the plots this time (unless you wish to).
| Prev | Contents | Next |
| Creating plots with the Data Wizard | Up | A Brief Overview of Data Objects |