
Manipulating Plot Layout
View objects in a Kst window are arranged in layers. Each object is positioned on one layer, and each layer contains only one object. Thus, view objects can overlap, with plots in higher layers taking precedence in visibility over those in lower ones. To change the layout of plots in Kst, layout mode must be activated. Layout mode can be toggled by selecting from the menu.
Moving and resizing view objects in layout mode is analogous to moving and resizing regular windows. To move a plot, simply click anywhere on the desired plot and drag the plot. An outline of the plot will appear, indicating where the plot will be placed, as shown in the following image.
You can drag plots anywhere within the current window. To resize a plot, move the mouse cursor to any edge or corner of the plot. The cursor will change to indicate that the plot can be resized. Click and drag the outline of the plot until the plot is the desired shape and size.
While layout mode is activated, right-clicking on any view object displays the basic context menu with several additional options. The selections available in this menu are listed below.
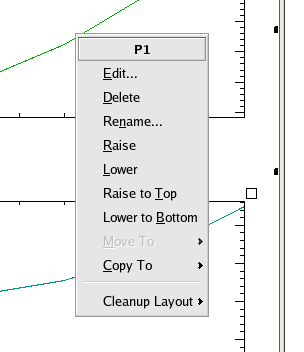
Raises the plot one layer up.
Lowers the plot one layer down.
Raises the plot to the top-most layer, guaranteeing that it will be visible.
Lowers the plot to the bottom-most layer.
Selecting a window name from this submenu moves the plot to the window with the corresponding name.
Selecting a window name from this submenu copies the plot to the window with the corresponding name.
If multiple view objects are selected in data mode, additional context menu items become available.
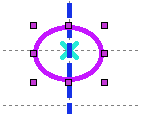
Two or more view objects can be selected together in layout mode. To select the objects, hold down the Shift key and either sequentially click on each you wish to select, or drag to draw a dotted rectangle around a group of view objects. The selected objects will be indicated by corner highlights, as shown below. Multiple selection allows you to move several view objects simultaneously by dragging any single object that is part of the selection. In addition, the layout mode context menu contains three additional items when multiple objects are selected. These items are described below.
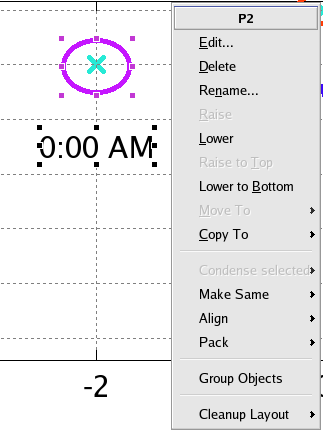
This option is available if the view objects which are selected are all plots. Selecting the X-axis or Y-axis options from this submenu removes either the X axis of the upper plot(s) or the Y axis of the rightmost plot(s) respectively. Note: this option does not rescale the plot data, so make sure that the original axes scales for all the plots are identical.
Resizes all the selected objects in the chosen dimension(s) to match the dimension(s) of the view object from which the context menu was invoked. For example, right-clicking on a plot in the group and selecting -> will match the width of all the plots in the group to the width of the first plot. If is chosen, both the width and height of each object in the selection will change.
Aligns all objects in the selection to the object directly underneath the context menu. Select from , , , or .
The submenu contains two functions. divides the entire width of the object group evenly between the individual object widths, while divides the entire height of the group evenly between the individual heights. Packing plots usually results in a staggered or “checkered” pattern. To align the plots in a grid, use the function of the layout mode context menu.
Groups all the selected objects together. A group of view objects can be resized or moved as a whole in the same way the layout of a object can be changed. Grouped plots remain grouped even when not in layout mode, so the or functions of the plot context menu can be used on an entire group of plots.
To dissociate a group, simply right-click on the group and select .


Would you like to make a comment or contribute an update to this page?
Send feedback to the KDE Docs Team