
KstScript
KstScript is a JavaScript binding for Kst. It aims to offer full control over all aspects of Kst. To enable KstScript, select -> and ensure that JavaScript Extension is checked.
There are three ways to to run a KstScript.
from the command line when starting Kst:
kst -E js:"loadScript('myscript.js')"using kstcmd. kstcmd is a JavaScript interpreter which connects to your Kst session. It can be run from an external terminal, or from within Kst itself by selecting ->.
kstcmd
Attached to Kst session kst-17704
kst> loadScript('myscript.js')
from the menu once Kst is loaded: ->
Note that with the first two methods, any KstScript command, or collection of KstScript commands can be substituted for the loadscript command.
KstScript gives Kst a powerful programming interface. Chiefly, it can be used to construct “smart” macro functions for common tasks. We will first look at a basic example illustrating how to control Kst through KstScript, and then we will look at an example of a macro function.
Here we have the “hello world” of KstScripts: plot a curve of random numbers.
// simple.js: A simple KstScript demo.
// Generates a new plot with a curve of random numbers.

// grab the window
var w = Kst.windows[0];

// add a plot to the window
var p = new Plot(w);

// create new (editable) vectors.
// these could also be loaded from files.
var xv = new Vector(); var yv = new Vector();

xv.tagName = "time"; yv.tagName = "signal";

// make their length 100.
xv.resize(100); yv.resize(100);

// fill in their values.
for (var i = 0; i < 100; i++) {
        xv[i] = i; //index
        yv[i] = Math.random(); //uniformly distributed between 0 and 1.
}

// create a curve from x and y
var c = new Curve(xv,yv);
c.tagName = "signalvstime";

// put the curve in our new plot
p.curves.append(c);

// label the x-axis of our plot
p.xAxis.label = "Time (s)"
This script can be run using any of the methods from the section called “Running a KstScript”. Here is a screenshot of Kst after entering the commands using the embedded console method.
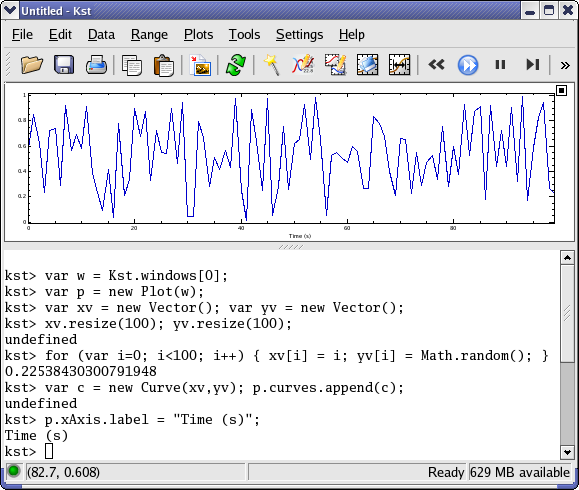
In the Kst UI, objects are not labelled by the variable names which we use in our KstScript, but are are referred to by their Tag Name (or "Unique Name"). If you do not manually set the tagName attribute of new objects, then when you look things up in the data manager you will find cryptic names like “anonymous vector 1”, or, “”. This is the reason why we received several “undefined” messages in the screenshot above. If you ever plan to use the UI to work with objects you have created with a KstScript, you will want to set their tagName property. You can also use tag names within KstScript itself. For example, after setting the tagName of our new curve we could have called
p.curves.append("signalvstime");
As with any JavaScript environment, you can write and call functions with KstScript. Additionally, KstScript possesses a means for a KstScript to load functions from disk. Consider the following example:
// subroutines.js

function takeSpectraOfTimePlots() {
//takes all of the plots in the first window which have an x-axis of "Time (s)"
// and generates power spectra for their curves, which it dumps into a single new
// plot.
        var w = Kst.windows[0];
        var p = new Plot(w);
        p.xAxis.label = "Frequency (Hz)"

        for (var ip = 0; ip < w.plots.length; ip++ ) {
                cp = w.plots[ip]; //current plot
                if (cp.xAxis.label == "Time (s)") {
                        for (ic = 0; ip < cp.curves.length; ic++) {
                                plotSpectrum(p,cp.curves[ic].yVector)
                        }
                }
        }
}

function plotSpectrum(p,v) {
//creates a power spectrum for the vector v and displays it in plot p. Assumes
//the vector is data sampled at 1Hz.
        ps = new PowerSpectrum(v, 1);
        ps.tagName = v.tagName + "-PS";
        c = new Curve(ps.xVector,ps.yVector);
        c.tagName = ps.tagName + "-C";
        p.curves.append(c);
}
This example contains two functions: takeSpectraOfTimePlots() and plotSpectrum(p,v). takeSpectraOfTimePlots() is a macro function which will generate spectra for all of the plots in the first window which have "Time (s)" as their x-axis. In this example, we can see the power of KstScript for such tasks.
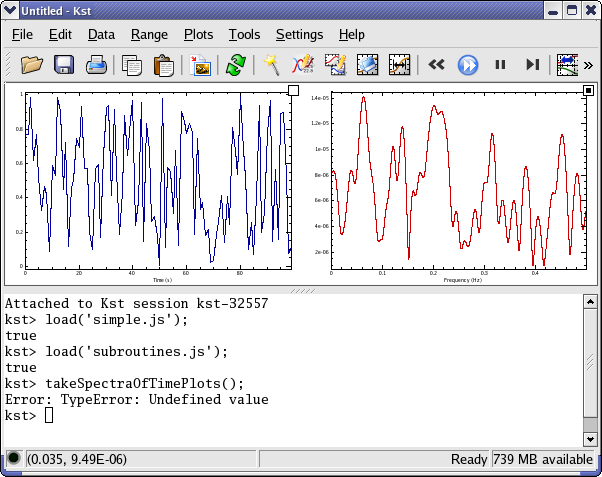
The following script loads these routines from the subroutines.js. It uses the simple.js of the previous section to generate a noise plot with a time axis, and then calls takeSpectraOfTimePlots() to find its spectrum. Notice that subroutines.js is loaded using loadScript(), the same call that we used from the command line in the section called “Running a KstScript”.
// callsubs.js
// demonstrate calling subroutines

loadScript('subroutines.js');
loadScript('simple.js');

takeSpectraOfTimePlots();
A screenshot of Kst after executing these commands is shown below.
Complete documentation on the KstScript classes is given in Appendix D.


Would you like to make a comment or contribute an update to this page?
Send feedback to the KDE Docs Team