
| Getting Started |
| Prev | Introduction | Next |
There are two main methods of quickly obtaining plots in Kst. The Kst command-line interface provides quick access to the main Kst features, while the graphical data wizard enables intuitive fine tuning of plot and data settings.
We first need a data file. Copy and paste this simple 40-line set of data into a text file,
and save it as simpledata.dat:
-20 100
-19 90.25
-18 81
-17 72.25
-16 64
-15 56.25
-14 49
-13 42.25
-12 36
-11 30.25
-10 25
-9 20.25
-8 16
-7 12.25
-6 9
-5 6.25
-4 4
-3 2.25
-2 1
-1 0.25
0 0
1 0.25
2 1
3 2.25
4 4
5 6.25
6 9
7 12.25
8 16
9 20.25
10 25
11 30.25
12 36
13 42.25
14 49
15 56.25
16 64
17 72.25
18 81
19 90.25
20 100
simpledata.dat is an example of an ASCII data file, one of the many file types
Kst is capable of reading. For further details on file types, see the chapter on
datasources. To produce a simple plot using
the first column (or “field”)
of this file an x vector, and the second column as a y vector, enter the following:
kst2 simpledata.dat -x 1 -y 2
Kst should start with the plot displayed:
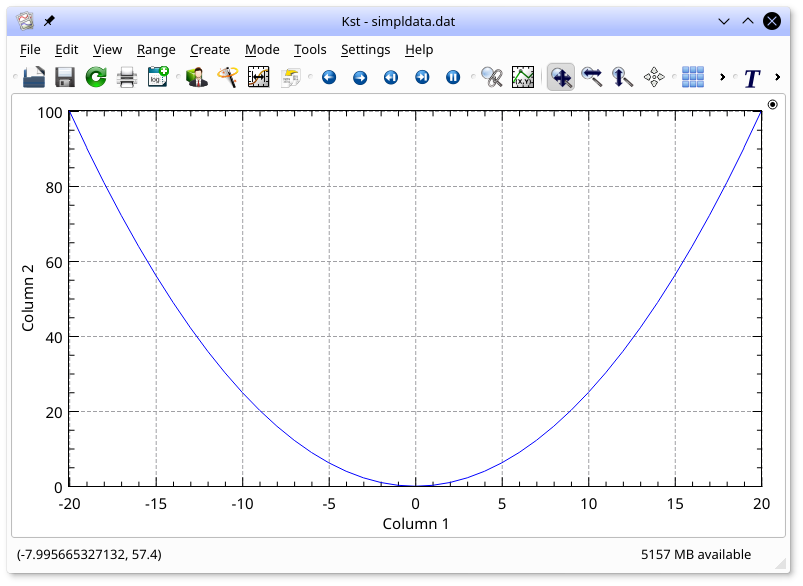
Numerous other command-line options are available—using the command-line only, plots of data can be printed directly to files, and simple data manipulation such as creation of power spectra can be performed as well.
If Kst is started without any command-line options, an unfilled kst window is shown. From there, a common first step is to create plots from the Data Wizard (click the toolbar button or press 'w'). The data wizard walks through the specification of a data file, selection of fields, and selection of plot options.
Any plot displayed in Kst can be manipulated. For example, dragging a rectangle anywhere within a plot will zoom in to that section of the plot. Holding Ctrl or Shift while dragging will zoom in on the x or y axis only, respectively, and tapping the arrow keys scrolls a plot.
| Prev | Contents | Next |
| Introduction | Up | The Kst Tutorial |