
Miscellaneous Plugins
The bin plugin group elements of a single data vector into bins of a specified size.
The value of each bin is the mean of the elements belonging to the bin.
For example, if the bin size is 3, and the input vector is
[9,2,7,3,4,74,5,322,444,2,1],
then the outputted bins would be
[6,27,257].
Note that any elements remaining at the end of the input vector that do not
form a complete bin
(in this case, elements 2 and 1), are simply discarded.
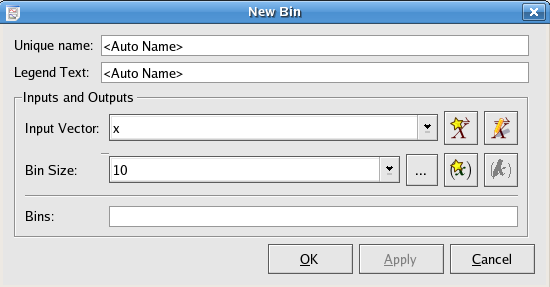
The vector to bin.
The size (# of elements) to have in each bin.
The binned map can generate a surface count or plot of a two-variable function.
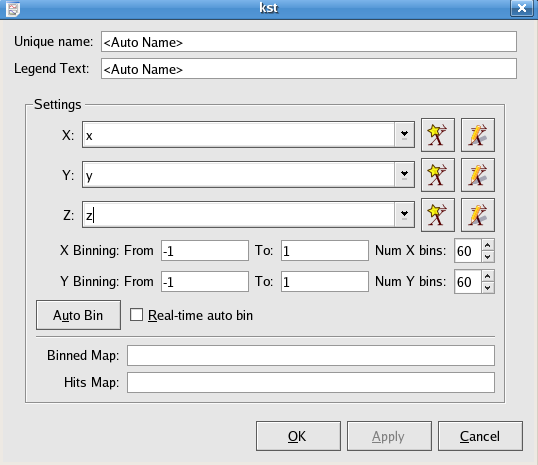
X/Y vectors are used to specify values of the two independent variables in a function, and Z vector specifies the values of the dependent variable.
Specify the range of X/Y values.
Specify the number of resolution grid for the output binned map.
Binned Map is a matrix whose entries can be used to generate the surface contour plot of the Z vector.
Hits Map is a matrix whose values are specified by the number of points in each X/Y bin, and the image of Hits Map indicates the positions where Z values have been located in the X/Y plane.
The chop plugin takes an input vector and divides it into two vectors. Every second element in the input vector is placed in one output vector, while all other elements from the input vector are placed in another output vector.
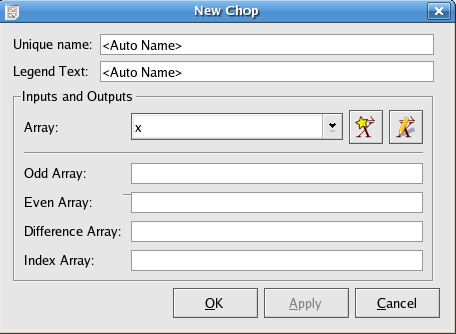
The array containing the odd part of the input array (i.e. it contains the first element of the input array).
The array containing the even part of the input array (i.e. it does not contain the first element of the input array).
The array containing the elements of the odd array minus the respective elements of the even array.
An index array has the same length as the other three output arrays.
The Convert time plugin converts a vector from one time format to another:
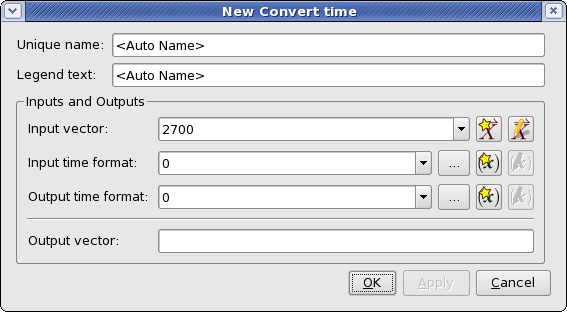
The vector holding the time values to be converted.
The time format of the values in the input vector. The formats are:
| 0: standard C time |
| 1: TAI |
| 2: JD |
| 3: MJD |
| 4: RJD |
| 5: JY |
| 6: TAI (ns) |
| 7: TAI (2^-16 sec) |
The time format for the values in the output vector. The formats are the same as for the input time format.
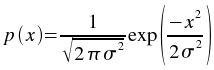
The Noise addition plugin adds a Gaussian random variable to each element of the input vector.
The Gaussian distribution used has a mean of 0 and the specified
standard deviation. The probability density function of a Gaussian random variable is:
The array of elements to which random noise is to be added.
The standard deviation to use for the Gaussian distribution.
This plugin subtracts the mean from the input vector and divides by the standard deviation.

This plugin calculates the phase value for each data point of an input time array.
An array of time values
Input data array corresponding to the time array
Set the period of the input time array.
Set the time for the zero phase.
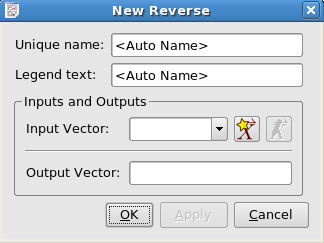
This plugin reverses the input vector.
This plugin shifts the plot of an input vector forwards or backwards on the X axis.
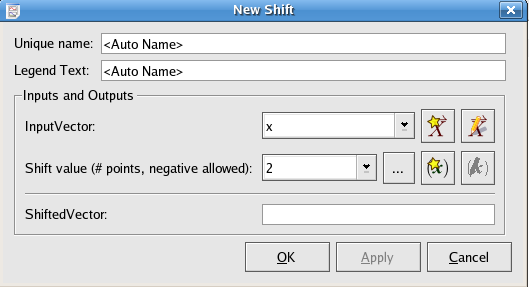
The vector to shift.
Specify the units to be shifted. Positive shifted value results right or forward shift. Negative shifted value results left or backwards shift.
The statistics plugin calculates statistics for a given data set beyond those automatically calculated by Kst. Most of the output scalars are named such that the values they represent should be apparent. Standard formulae are used to calculate the statistical values.
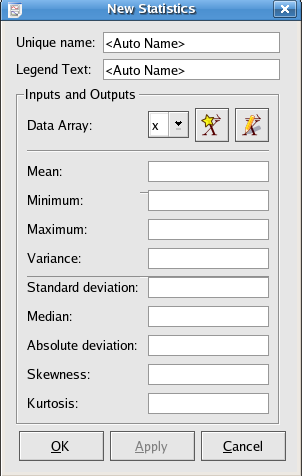
The mean of the data values.
The minimum value found in the data array.
The maximum value found in the data array.
The variance of the data set.
The standard deviation of the data set.
The median of the data set.
The absolute deviation of the data set.
The skewness of the data set.
The kurtosis of the data set.
This plugin groups y values of a data set into bins defined by x values.
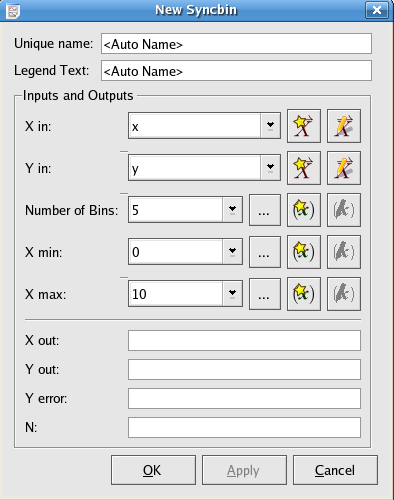
The X values of a set of data points
The Y values of a set of data points
Specify the number of bins used to group the data points
Specify min/max X values of a data set to indicate the range of data points needed to be grouped.
The X values after binning. The X out vector is composed of the median values of the X elements in each bin
The Y values after binning. The Y out vector is composed of the mean values of the Y elements in each bin
This vector is composed of the standard deviations of the Y values in each bin.
The N vector is composed of the number of data points in each bin.


Would you like to make a comment or contribute an update to this page?
Send feedback to the KDE Docs Team