
Zooming and Scrolling
Zooming and scrolling in plots is easy and intuitive with Kst. The following sections explain the different zooming and scrolling modes.
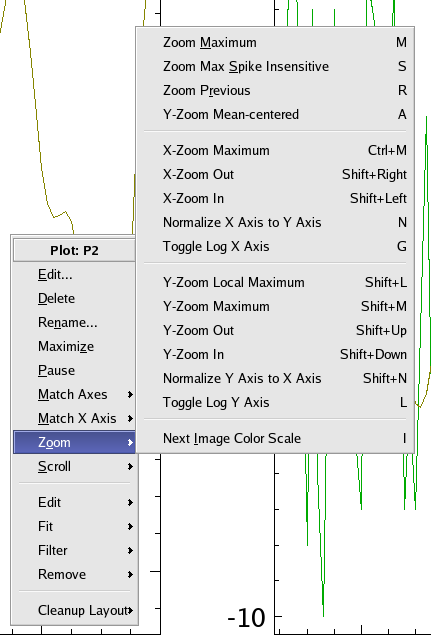
To access the different zoom modes, choose one of , , or from the menu. The different modes are described below.
In XY Mouse Zoom mode, you can zoom into a specific rectangular area of the plot by simply clicking and dragging to draw a rectangle where desired. The x and y axes of the plot will change to reflect the new scale. This mode is often useful for quickly looking at an interesting area of the plot without having to specify exact axis scales.
In X Mouse Zoom mode, the y axis is fixed. Zooming in is performed by clicking and dragging a rectangular area; however, the upper and lower limits of the rectangle will always be equal to the current upper and lower limits of the y axis. This mode is often useful for looking at a certain time range, if the x axis happens to represent a time vector.
You can quickly switch to X Mouse Zoom mode by holding down Ctrl. The mouse cursor will change to indicate the new mode. Releasing Ctrl will return you to the previous mouse zoom mode.
In Y Mouse Zoom mode, the x axis is fixed. Zooming in is performed by clicking and dragging a rectangular area; however, the left and right limits of the rectangle will always be equal to the current left and right limits of the x axis. This mode is often useful for zooming in on data that is concentrated around a horizontal line.
You can quickly switch to Y Mouse Zoom mode by holding down Shift. The mouse cursor will change to indicate the new mode. Releasing Shift will return you to the previous mouse zoom mode.
When in any of the mouse zoom modes, right clicking on a plot brings up some special zoom options, in addition to the basic context menu options.
Temporarily expands the plot so that it takes up the entire area of the window. Uncheck this option to return the plot to its previous size.
Pauses automatic update of live data. This menu item duplicates the functionality of from the menu.
These options allow you to quickly change the axes of a plot to match those of another plot. Both the X and Y axes scales of the current plot will change to match those of plot which you choose from the submenu. Note that this does not permanently tie the axes scales together; changing the zoom on either plot will unmatch the axes scales again. To tie the axis scales of two or more plots together, use the Tied Zoom feature.
This option allows you to quickly change the X axis of a plot to match that of another plot, similarly to the Match Axes submenu.
The submenu is described in the section entitled The Zoom Menu.
This menu is described in the section entitled The Scroll Menu.
This submenu displays a list of objects available for editing in the underlying plot. Clicking on an object name from the submenu displays the Edit dialog for the object.
This submenu displays a list of curves which can be fit. Selecting a name from the submenu displays a New Plugin dialog which allows you to choose a fit plugin. The input vectors are prechosen based on the curve selected.
This submenu displays a list of data objects that can be filtered. Selecting a name from the submenu displays a New Plugin dialog which allows you to choose a filter plugin. The input vector to be filtered is selected based on the curve. In addition, curve appearance properties can be changed, as the Filter function creates vectors, and curves based on the vectors.
This submenu displays a list of curves currently in the plot. Clicking on a curve name from the submenu removes the curve from the plot (the curve itself, however, is not removed as a data object).
The menu can be accessed by right-clicking on a plot and selecting the submenu from the context menu. A list of zoom actions and their corresponding keyboard shortcuts will be displayed. These actions are described below.
| Zoom Action | Keyboard Shortcut | Description |
|---|---|---|
| M | Sets both the x axis and the y axis scales so that all data points are displayed. This is equivalent to the AutoScale setting of the Plot Dialog. | |
| S | Sets both the x axis and the y axis scales so that most data points are displayed. Spikes, or sudden increases or decreases in x or y values, are excluded from the plot display. | |
| R | Returns to the most recent zoom setting used. | |
| A | Sets the Y axis so that the mean of the y values in the plot is centered vertically. The actual zoom level is not changed. | |
| Ctrl+M | Sets the x axis scale such that the x values for all data points are between the minimum and maximum of the x axis. The y axis scale is unaltered. | |
| Shift+Right | For a non-logarithmic x axis, increases the length of the x axis by a factor of approximately 0.5, without changing the midpoint of the x axis. The y axis scale is unaltered. | |
| Shift+Left | For a non-logarithmic x axis, decreases the length of the x axis by a factor of approximately 0.5, without changing the midpoint of the x axis. The y axis scale is unaltered. | |
| N | Sets the length of the X Axis to be equal to that of the Y Axis, maintaining the current center. | |
| G | Enables or disables using a logarithmic scale for the x axis. | |
| Shift+M | Sets the y axis scale such that the y values for all data points are between the minimum and maximum of the y axis. The x axis scale is unaltered. | |
| Shift+Up | For a non-logarithmic y axis, increases the length of the y axis by a factor of approximately 0.5, without changing the midpoint of the y axis. The x axis scale is unaltered. | |
| Shift+Down | For a non-logarithmic y axis, decreases the length of the y axis by a factor of approximately 0.5, without changing the midpoint of the y axis. The x axis scale is unaltered. | |
| Shift+N | Sets the height of the Y Axis to be equal to that of the X Axis, maintaining the current center. | |
| L | Enables or disables using a logarithmic scale for the y axis. | |
| I | Only has any effect on an image; cycle through the extreme values of the image matrix to redefine the threshold values of the image scale every time; its purpose is to let the user better view the intermediate values of an image |
Many of the zoom actions are best used in conjunction with the various mouse zoom modes.
Functions for scrolling a plot are available by right-clicking a plot and selecting the submenu from the context menu. Most scrolling functions and their keyboard shortcuts should be self-explanatory. To quickly jump to a plot marker, select Next Plot Marker (to jump right) or Previous Plot Marker (to jump left). For more information on plot markers, see the documentation on the Markers section of the Edit Plot Dialog.
Assuming non-logarithmic axis scales are used, each function scrolls the plot in the indicated direction by 0.1 of the current length of the x axis (when scrolling left or right), or 0.25 of the current length of the y axis (when scrolling up or down).
You can also scroll left or right in a plot by using the mouse wheel (if available).
To quickly go forwards or backwards along the x axis, select or from the menu. The keyboard shortcuts, Ctrl+Left and Ctrl+Right respectively, can be used as well.
When looking at two or more related plots (for example, two curves on separate plots both dependent on the same time vector), it can sometimes be useful to zoom or scroll the plots simultaneously. This is possible using Kst's tied zoom feature. To activate tied zoom, click the small square at the top-right corner of the plots you wish to tie together. The squares will change colour to indicate the plots are tied, as shown below.
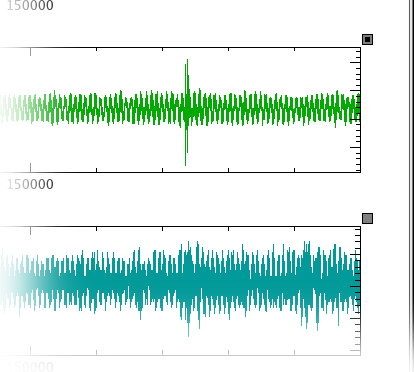
Zooming and scrolling actions performed on one plot in a group of tied plots will be performed on all the plots in the group. To remove a plot from the tied group, simply click on the small square at the top-right corner of the plot again. The square will become transparent to indicate that the plot is not tied.
To quickly tie or untie all plots (including plots in other windows), select
from the menu, or the corresponding icon
 on the Ksttoolbar.


Would you like to make a comment or contribute an update to this page?
Send feedback to the KDE Docs Team