
Using Plugins through KstScript
Plugins can also be generated and edited through KstScript. See details in the Plugin class in the Working With KstScript chapter.
To create a new plugin, using the following syntax:
plugin = new Plugin(Kst.pluginManager.modules["Plugin Name"])
//the "Plugin Name" should be typed exactly as shown in the Create Plugin tab in the Data Manager.
To set input values of this plugin
plugin.setInput(index of input,value of input);
You must validate the plugin before you can get its outputs. To validate the plugin, use the following method:
plugin.validate();
The output values stored in Kst as an objectcollection. To get an output of this plugin, you need to specify its index:
v = plugin.outputs[index of output];To know the index of inputs and outputs, refer to their appearing orders in dialogs of plugins UI.
See two examples below of using plugins through KstScript
Example 8.1. KstScript of Statistics Plugin
p = new Plugin(Kst.pluginManager.modules["Statistics"]);//create a new statistics plugin
p.tagName = "Stat"; 			// this will be the plugin name in the data manager
p.setInput(0, "x");			//x is the name of a vector whose various
                   			//statistical values are needed
p.validate(); 				//validate the plugin
s = new Scalar();
s = p.outputs[0];			//to get the first output of this plugin, i.e the mean of x
s.value					//the value of s will be printed on the screen, e.g. -4.12232621329268
Example 8.2. KstScript Function of Using Interpolation Plugins
All Kst interpolation plugins have the same inputs and outputs; therefore, instead of writing lots of similar code to set inputs and get outputs for different interpolation schemes, we can write a kstScript function to do that.
The following is a KstScript function which needs 3 vectors: x, y, ix, and a string as inputs. The function will use the string to specify an interpolation plugin, and apply the specified interpolation scheme to x, y vectors in order to get the interpolated y values for ix vector. Then the function will plot y vs x, and interpolated y vs ix.
//intplFuction.js
function intpl(x,y,ix,intpl){
//x is a vector used as X Array in interpolation plugins
//y is a vector used as Y Array
//ix is a vector used as X' Array
//intpl is a string used to specify the name
//of a specific interpolation plugin, such as "Interpolation akima spline".
//construct a new interpolation plugin
 pl = new Plugin(Kst.pluginManager.modules[intpl]);
 pl.tagName = intpl+"plugin";
//set the Inputs of the plugin
 pl.setInput(0,x);
 pl.setInput(1,y);
 pl.setInput(2,ix);
 pl.validate(); //validated the plugin

iy = pl.outputs[0]; //gets the output vector from this plugin
iy.tagName = "interpolated_y"; //call it interpolated_y vector in the data_manager
//open a new window to plot x vs y and ix vs interpolated_y;
w=new Window();
p=new Plot(w);
c1 = new Curve(x,y);
c1.tagName = "y";
c2 = new Curve(ix,iy);
c2.tagName = "interpolated_y";
p.curves.append(c1);
p.curves.append(c2);
p.xAxis.label = "X";
p.yAxis.label = "Y";
//edit the settings of the curves, such as line style, point style, etc
//in order to make the two curves more distinguishable
c1.hasPoints = true;
c1.pointStyle = 3;
c1.lineStyle = 1;
c1.lineWidth = 2;
c2.hasPoints = true;
c2.pointStyle = 0;
c2.lineWidth = 1;
//add an legend
l = new Legend(w);
l.fontSize = 5;
l.addCurve(c1);
l.addCurve(c2);
   }
Let us see an example of using the above function. First, save the above script in a file called intplFunction.js in your home folder, and open a new text file to copy the following lines, then save this file as intplTest.js in your home folder.
//intplTest.js
//construct 2 vectors x and y, with y = sin(x) and x = {-10,-9,-8...0...8,9,10}
x = new Vector();
x.tagName = "x";
y = new Vector();
y.tagName = "y";
x.resize(21);
y.resize(21);
var k=-10;
for(var i=0; i<21; i++){
x[i]=k;
y[i]=Math.sin(x[i]);
k++;}
//construct the ix vector; ix={-10,-9.75,-9.25,-9,...0...9,9.25,9,75,10}
//The y values of ix will be obtained by interpolation.
ix=new Vector();
ix.tagName = "ix";
ix.resize(81);
var k=-10;
for(var i=0; i<81; i++){
ix[i]=k;
k = k+0.25;}
//load intpl function script
loadScript('/home/vyiwen/intplFunction.js');
//call intpl function
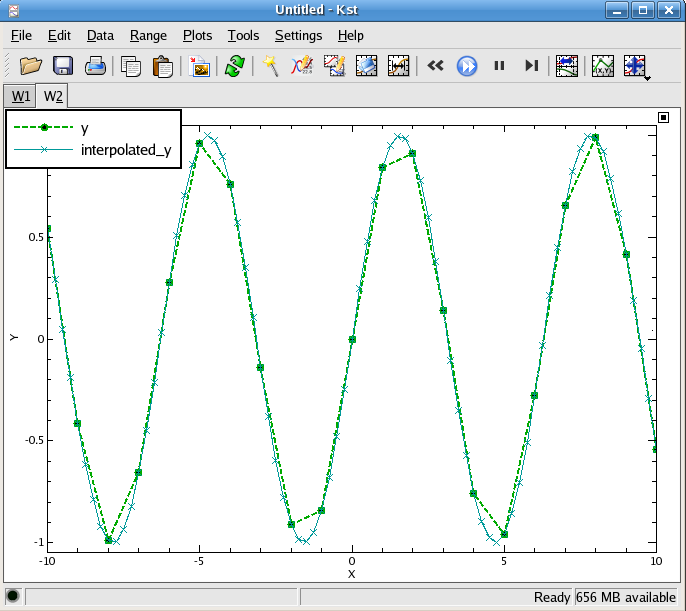
intpl(x,y,ix,"Interpolation cubic spline")
Open Kst, and load intplTest.js in the Java Console like this:
loadScript('/home/vyiwen/intplTest.js');
After loading the script, you should see the plots below:


Would you like to make a comment or contribute an update to this page?
Send feedback to the KDE Docs Team