
Common Tasks
This chapter contains instructions for performing basic tasks with Kst. It runs through the method for performing each task in the simplest way. Links to the sections of the handbook with more in-depth information are also given.
The first thing you'll want to do with Kst is probably to plot a simple graph. Here's the procedure:
Choose your data file. Kst will read many types of
data file, the simplest being a plain text (ASCII)
file with the data in columns. For this tutorial, we'll create a simple data file. Copy and paste this simple 10-line set of data into a text file,
and save it as simple.dat:
x  y
-5 6.25
-4 4
-3 2.25
-2 1
-1 0.25
0 0
1 0.25
2 1
3 2.25
4 4
5 6.25
ASCII is only one of the many file types Kst is capable of reading. For further details on file types, see the Datasources section.
Open Kst. If you are presented with the
QuickStart dialog, then click on the button. If the QuickStart dialog does not appear, then you can click the ![]() toolbar button to open the Data Wizard. In the wizard that appears, you can enter the pathname of the simple.dat file manually, or select it using the icon
toolbar button to open the Data Wizard. In the wizard that appears, you can enter the pathname of the simple.dat file manually, or select it using the icon
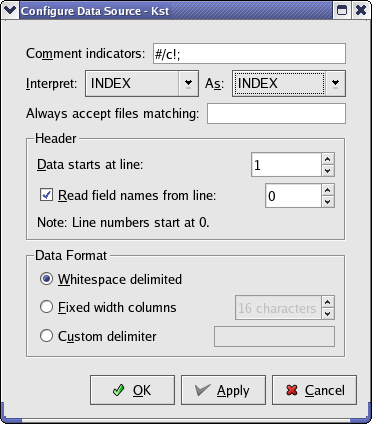
![]() which appears next to the path entry textbox. We have put x and y labels on the first line of our data file, so click the button and set up the data source as shown below.
which appears next to the path entry textbox. We have put x and y labels on the first line of our data file, so click the button and set up the data source as shown below.
The page is where you select which data to use. If you've configured the ASCII datasource correctly, the field names will have been read from the first entry of the datafile and “x” and “y” will be entries in the Available list on the left-hand side of the page. Move the “y” field to theSelected list using the arrow buttons in the center of the window. The INDEX field is a special field created by Kst; it can be used as X-axis data when the data source does not provide a data vector for the X-axis.
Clicking the button again allows you to select Data Presentation options. Under Plot Types, leave the default XY as it is, but change the X Axis Vector to Create From Field: x.
On the page, 'Plot Layout', we'll just change one thing: under Curve Style, select Points only to draw just the data points, and not the lines joining them.
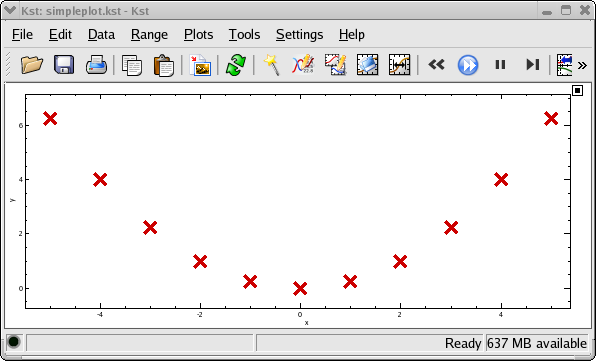
Click on and you're done! The new plot appears in the main Kst window.
It's also possible to quickly create plots from the command line using Kst, similar to Gnuplot. In the case of the simple.dat file, we can produce a simple plot using the first column (or “field”) of the file as the x vector, with the second column as a y vector, by entering the following at the command line:
kst -x 1 -y 2 simple.dat
Numerous other command-line options are available — using the command-line only, plots of data can be printed directly to files, and simple data manipulation such as creation of power spectra can be performed as well. For a complete list of command-line options, see Command Line Usage and Examples.


Would you like to make a comment or contribute an update to this page?
Send feedback to the KDE Docs Team